Dynamic Adaptive Policy Pathways (DAPP)
Purpose of the tool
This approach helps policy makers to develop adaptation strategies under deep uncertainty. Opportunities, threats, timing and sequence of policy options are identified, which can be used by policymakers to develop water management roadmaps into the future. The strategies are flexible to adapt to changing conditions, such as climate change and uncertain socio-economic developments.
Target group
Policy makers involved in long-term water management.
Tool description
The framework uses adaptation tipping points and adaptation pathways. Adaptation tipping points are conditions at which a policy action begins to perform unacceptably as objectives are no longer met. Consequentially, additional actions are needed. However, each new action also has its own tipping point, so that a new strategy has to be created again. Adaptation pathways are a sequence of policy actions to achieve objectives under changing conditions. With an adaptation pathways map, decision makers can identify opportunities, no regret actions, lock-ins, and the timing of an action, in order to support decision making in a changing environment. That is, the adaptation map can be used to prepare a plan for actions to be taken immediately, and for preparations that need to be made in order to be able to implement an action in the future in case conditions change.
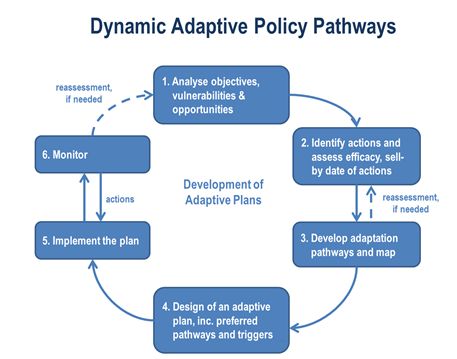
Summary of steps in the DAPP approach
With this tool, a policy maker can develop a plan that commits to short term actions and establishes a framework to guide future actions. So, policy makers will have a range of options from which they can choose. Their strategies can be adapted over time, e.g. in response to events, such as floods and droughts, or changing conditions such as societal perspectives, new technologies or new insight on future climate change.
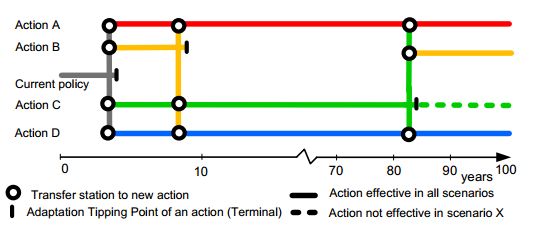
Adaption Pathways Map
An example of an Adaptation Pathways map (left) and a scorecard presenting the costs and benefits of the 9 possible pathways presented in the map. In the map, starting from the current situation, targets begin to be missed after four years. Following the grey lines of the current policy, one can see that there are four options. Actions A and D should be able to achieve the targets for the next 100 years in all climate scenarios. If Action B is chosen after the first four years, a tipping point is reached within about five years; a shift to one of the other three actions will then be needed to achieve the targets (follow the orange lines). If Action C is chosen after the first four years, a shift to Action A, B, or D will be needed in the case of Scenario X (follow the solid green lines). In all other scenarios, the targets will be achieved for the next 100 years (the dashed green line). The colors in the scorecard refer the actions A (red), B (orange), C (green), and D (blue).
Result description
The tool has been used to produce an adaptive plan for long-term water management of the Rhine Delta in the Netherlands (scientific article, Haasnoot et al, 2013). The results have proven the tool to be successful. The images below illustrate some of the results of the research in the Ijsselmeer and IJssel region.
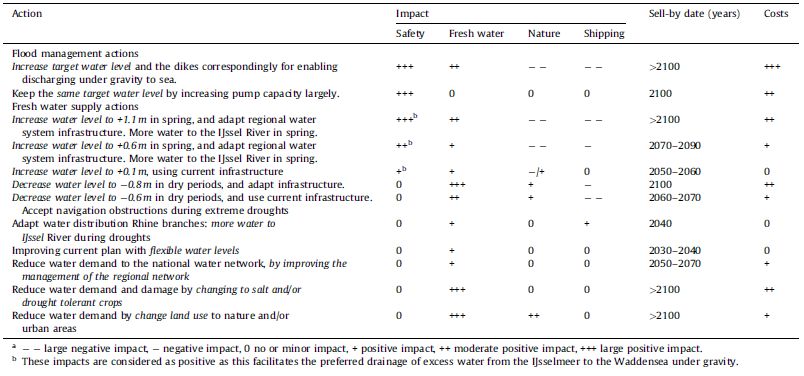
Actions and assessment of their relative performance in terms of impacts on safety, fresh water
capacity, side impacts on nature areas and shipping in the IJsselmeer and IJssel region, and
sell-by date of actions based on preliminary expert knowledge and modelling results.
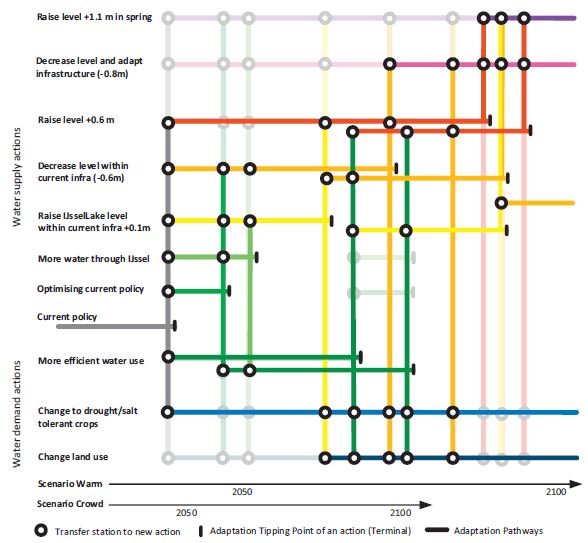
Adaptation pathways map for fresh water supply from the IJsselmeer area
The tool in practice
The framework has been applied in the Rhine Delta, Netherlands. Tests have been done in Thailand. It’s currently being applied on several case studies in Europe (within the EU BASE project).
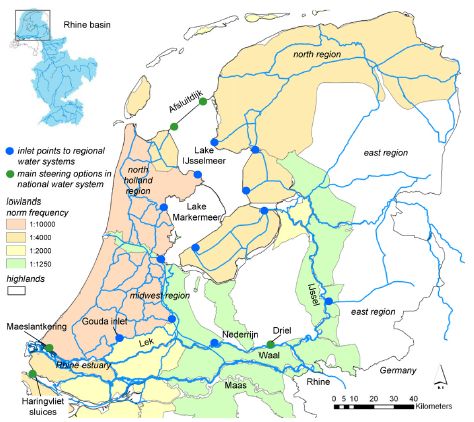
Case study location: Lower Rhine Delta in the Netherlands, with focus on the IJsselmeer area
Necessary inputs and conditions
Users need knowledge on the framework and the area of study.
Contact data
Institute: Deltares
Contact: Marjolijn Haasnoot (Marjolijn.Haasnoot(at)deltares.nl)
Phase and tool category: Strategy Development and Planning | Conceptual Tools
Spatial scale and time scale
All scales: global, through river basin to local
Time scale: years
Tool availability
The framework is explained in different articles.
Downloads
- Haasnoot, M., et al., Dynamic adaptive policy pathways: A method for crafting robust decisions for a deeply uncertain world. Global Environ. Change (2013)