NTM model for a biodiversity index
Purpose of the tool
NTM is a simple and quick tool to assess the biodiversity of plant species. It can help to evaluate the effect of external and internal pressures on ecosystems. Pressures may be changes of land use and management, climate change, flooding or nitrogen deposition. The model can be used for policy evaluation and for assessing effects of management on nature.
Target group: governments, nature organizations, land owners
Tool description
The model provides a biodiversity index value for plant diversity, based on the red list criteria for plant species. The biodiversity index is linked to three abiotic parameters for nutrient availability, groundwater table and soil acidity. When these three parameters are given as input together with the ecosystem type (heath, forest or grassland), it will calculate an index value. The higher the index value, the higher the chance of presence of red list species. The model is often used as an end tool for model evaluations of nature policy in combination with e.g. VSD+ SUMO.
Result description
The map below shows the biodiversity index for a region in the Netherlands. Here the effect of climate change is combined with water management measures. The models VSD+ SUMO calculated the effects on the soil properties, and their output subsequently served as input for NTM. Several scenarios were evaluated and compared regarding the effect on the biodiversity index provided by NTM. Red colours indicate a relative low biodiversity index, green colours a relative high biodiversity index. The higher the index, the higher the change that red list species will be present in the field.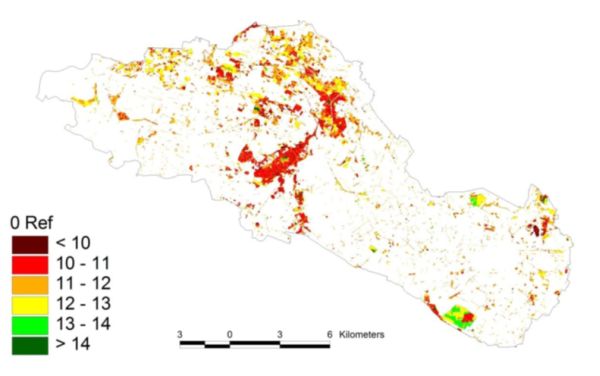
The tool in practice
NTM was applied in the river Rhine Delta.
Necessary inputs and conditions
The model needs as inputs the ecosystem type and the values for nutrient availability, soil acidity and groundwater table. The model has been calibrated for the river Rhine delta. If it is used outside that area a calibration set of vegetation plots is necessary and a list of nature conservation values per species based on the red list criteria.
Contact data
Wieger Wamelink, wieger.wamelink(at)wur.nl Alterra, Wageningen UR
Phase and tool category: Problem Analysis | Physical models
Spatial scale and time scale
NTM is a point model for the local/regional scale.
Years/decades
Tool availability
NTM is only available in collaboration projects, there is no user friendly interface.