Climate Adaptation Atlas for spatial planning
Purpose of the tool
The Climate Adaptation Atlas (CAA) discloses and visualises scientific information on climate change in the form of maps. These maps support spatial planning and decision making. The Dutch Climate Adaptation Atlas consists of a large number of maps disclosed via an online Geoportal (in Dutch). The same technology was used in Bangladesh.
Target group
This approach can be an important tool in bridging science, policy and private sector around the world. The tool can be further developed by a consortium consisting of knowledge institutes (Alterra, Wageningen UR, Deltares, KNMI) and consultants (DHV Group, Geodan Next) in close collaboration with regional stakeholders and governments.
Tool description
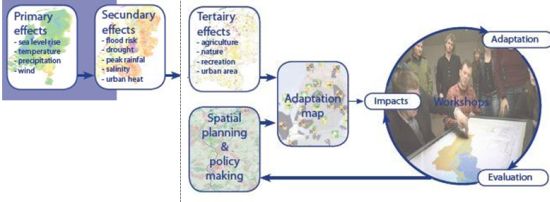
Maps are important for the development of adaptation strategies because they show where problems occur and how they are related to other functions in the landscape. The Climate Adaptation Atlas contains a wealth of information on climate change impacts, e.g. flood modelling, urban heat island effect, crop drought sensitivity and sensitivity of nature types to droughts. This helps users to identify key adaptation challenges in their areas of interest. The impact and adaptation maps are used in several interactive and multidisciplinary workshops between scientist, policy makers and spatial planners. Together the participants design adaptation options based in the local impacts of climate change. The adaption options are evaluated on their effectiveness and social costs and benefits. These workshops proved to be very helpful in investigating robust adaptation strategies, leading to an increased political support for action.
Result description
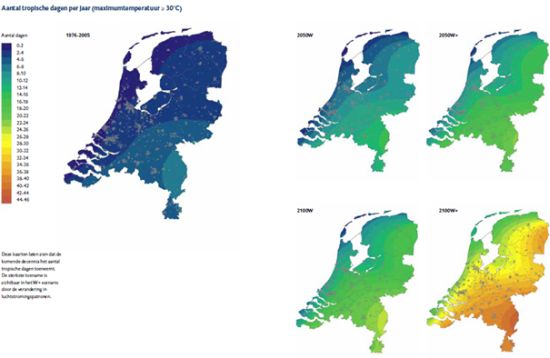
The Atlas combines the different effects of climate change with landscape characteristics like land use and population density. It then visualizes the main conclusions in an adaptation map, highlighting areas where adaptation is more urgent. Furthermore it extrapolates this to different climate scenarios. Below is an example showing the increase in tropical days in the Netherlands in 2050 and 2100 for two different climate scenarios. Such maps highlight areas that may face future damage or opportunities due to climate change.
The tool in practice
The CAA methodology has proven to be effective in supporting local and regional governments to develop adaptation strategies. The methodology can easily be applied elsewhere in the world. The consortium has the knowledge and expertise as well as the experience with facilitating adaptation planning processes. The atlas has been developed and used for the Bangladesh region: read more in this pdf file.
Contact data
Organisation: Alterra, Wageningen UR
Contact: Dr. Hasse Goosen, hasse.goosen(at)wur.nl
More information
Phase and tool category: Problem Analysis | Integral approaches
Spatial scale and time scale
The Climate Adaptation Atlas has proven to be an effective discussion/ decision support tool for climate adaptation at the regional level. The time scale depends on the climate scenarios used which is often a range of dates between 1990 and 2100.
Tool availability
For the Netherlands the tool is available on the internet. Once created (a GIS map filled with data), the tool is available for free.